The circle packing chart visualizes data as a series of circles; the size of each circle is driven by the value, while its color is driven by the given member hierarchy. The circle packing chart is a good way to organize large amounts of non-hierarchical data into groups, to get a high-level overview at a glance.
Build a Circle Packing Chart
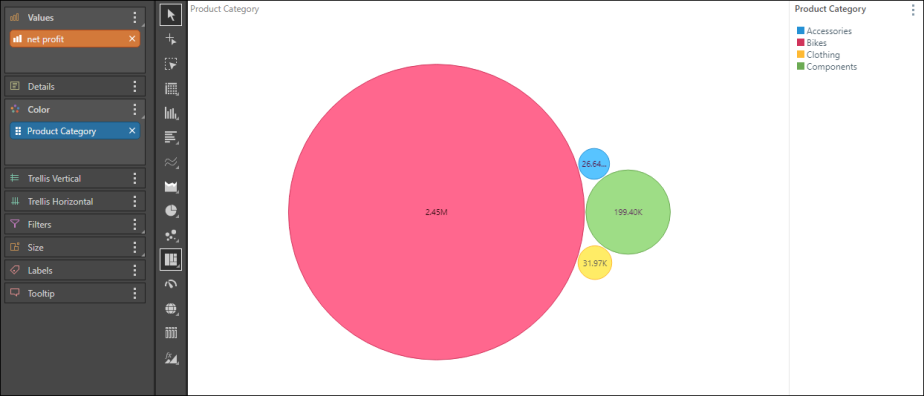
To build a circle packing chart add a blue chip to the Color zone, and a measure to the Values zone.
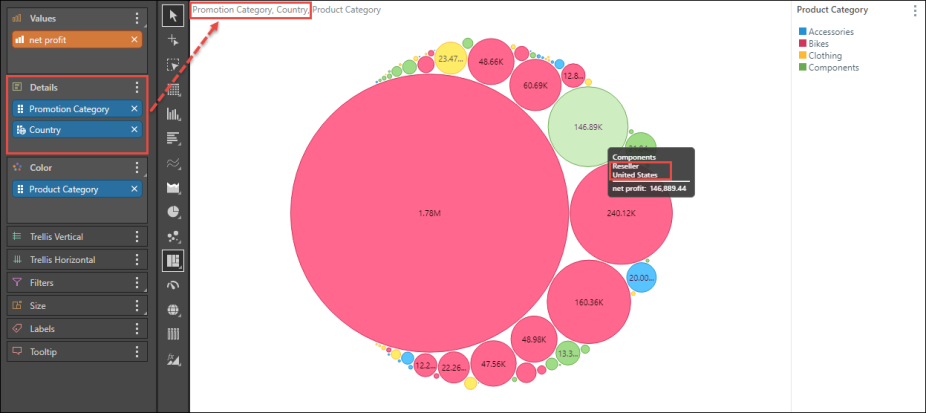
You can add more context by placing additional blue chips in the Details zone; the corresponding member elements will be listed in the tooltip for each data point:
Examples
Open the Sample Demo model to follow the examples below.
Example 1
Step 1
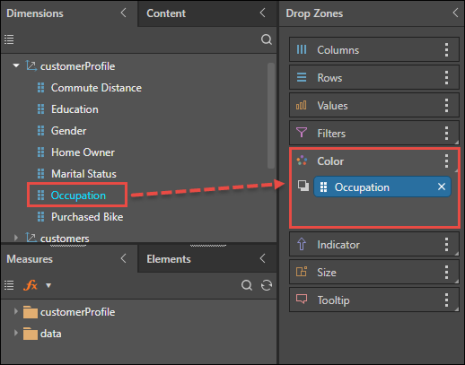
Start by opening the Customer Profile dimension and adding the Occupation hierarchy to the Color drop zone.
Step 2
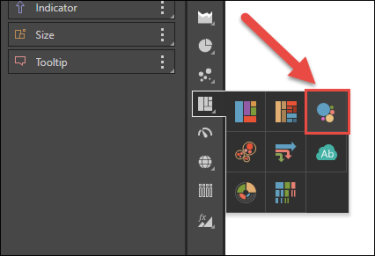
Select Circle Packing Chart from the visualization menu.
Step 3
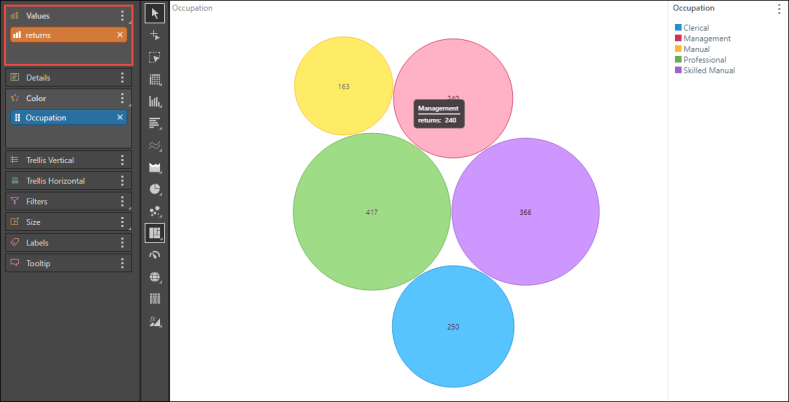
Add the Returns measure to Values. Now you have a basic circle packing chart showing the number of returns by occupation; it's easy to see at a glance which occupations accounted for the most and least returns.
Example 2
Following on from Example 1 (above), follow the steps below to build a more advanced visualization.
Step 1
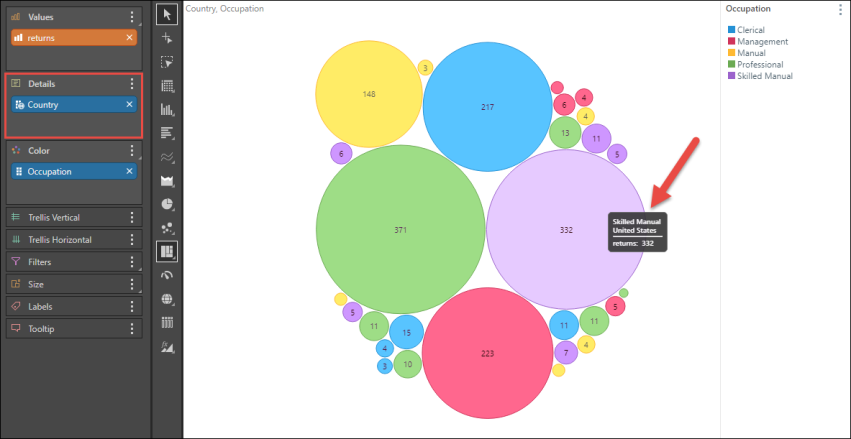
From the Customers dimension, add the Country hierarchy to the Details drop zone. This further breaks up the circles according to country, as is seen in the tooltip when hovering over a data point. For instance, each blue circle represents the same occupation type (Clerical), but a different country. Thus we can see clusters or differences in patterns of returns by occupation, across countries.
Step 2
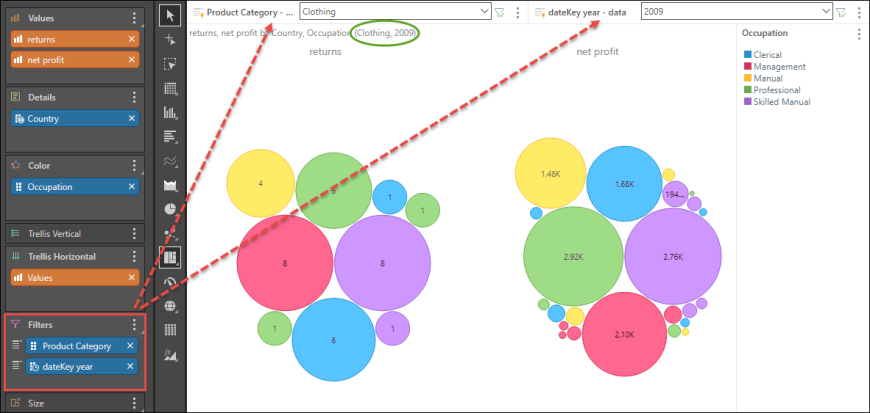
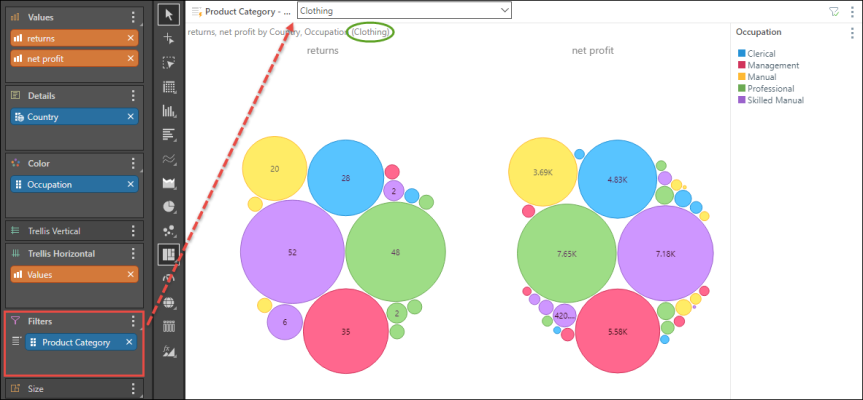
Add the Net Profit measure to the Trellis Horizontal zone to compare returns with net profit.

Step 3
From the Products dimension, add the Product Category hierarchy to Filters, to filter the query by product type on the fly. The slicer selection is reflected in the breadcrumb trail (green highlight).
Step 4
From the Data dimension, add the dateKey year hierarchy to Filters to add a second slicer to the query, and filter results by year.